|
World Water Consumption
1950-2000
22" diameter x 4" (on a stand)
found metal and glass
Brent Bukowski 2005
Pat Forsyth photo |
World Water Consumption 1950
|
SECTOR |
1950
km3/year |
2000
km3/year |
|
Agriculture |
722.0 |
1834.0 |
|
Industrial |
16.7 |
52.8 |
|
Municipal |
19.1 |
87.9 |
|
Reservoirs |
11.1 |
208.0 |
|
Difference |
1414 |
|
|
% change
from 1950 to 2000 |
+254% |
|
INSERT:
|
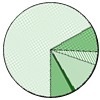
Water Consumption
by Region (2000)
|
REGION |
km3/year |
|
Africa |
170.0 |
|
Asia |
1458.0 |
|
Europe |
197.0 |
|
Latin America |
96.0 |
|
North America |
243.0 |
|
Oceania |
18.7 |
|
TOTAL |
2182.7 |
|
|
SOURCE:
|
“World
Water Resources at the Beginning
of the 21st Century” (prepared
in the framework
of IHP
UNESCO) |
|
