|
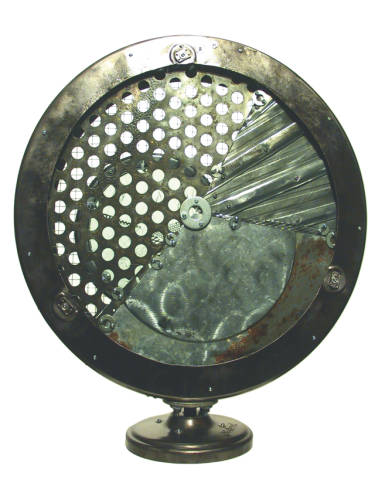
Nuclear Energy Study
1965-2004
22" diameter x 3" (freestanding)
found metal and glass
Brent Bukowski 2005
Pat Forsyth photo |
Nuclear Energy Study
2004
|
Region |
Nuclear Energy
(million tonnes of
oil equivalent) |
|
|
1965 |
2004 |
|
Africa |
0 |
3.4 |
|
Asia Pacific |
0 |
118.9 |
|
Europe & Eurasia |
4.9 |
287.2 |
|
S. & C. America |
0 |
4.4 |
|
North America |
1 |
210.4 |
|
Difference |
618.4 |
|
% change
from 1965 to 2004 |
+10,581% |
|
SOURCE:
BP
Statistical Review Energy Charting Tool |
|
|
|
|