|
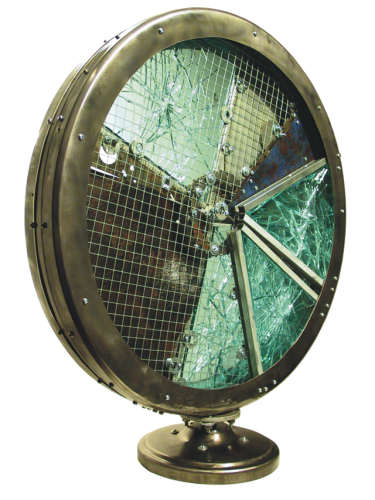
Hydro-electricity Study
1965-2004
22" diameter x 3" (freestanding)
found metal and glass
Brent Bukowski 2005
Pat Forsyth photo |
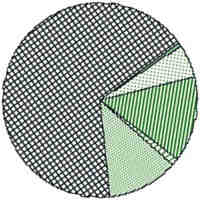
Hydro-electricity Study
1965
|
Region |
Hydro-electricity
(million tonnes of
oil equivalent) |
|
|
1965 |
2004 |
|
Africa |
3.1 |
19.8 |
|
Asia Pacific |
34.6 |
152 |
|
Europe & Eurasia |
89.8 |
184.7 |
|
S. & C. America |
9.1 |
132.1 |
|
North America |
72.9 |
141.9 |
|
Middle East |
0.5 |
0.5 |
|
Difference |
421 |
|
% change
from 1965 to 2004 |
+187% |
|
|
|
SOURCE:
BP
Statistical Review Energy Charting Tool |
|
