|
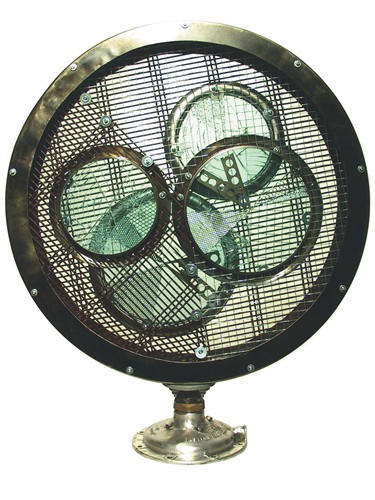
Calories, Proteins and Fats
1961-2002
24" diameter x 3" (freestanding)
found metal and glass
Brent Bukowski 2005
Pat Forsyth photo |
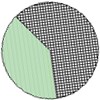
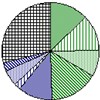
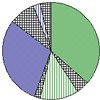
Calories, Proteins and Fats
1961
|
World
Daily Calorie Supply
(millions of calories) |
|
1961 |
2002 |
|
6,924,916.9 |
17,399,315 |
|
difference |
10,474,478 |
|
%
change from 1961 to 2002 |
+251% |
|
 |
INSERTS:
|
 |
 |
Protein and Fat
Per Capita Supply Per Day (Grams) |
| |
1961 |
2002 |
|
Developed
Countries: |
|
|
|
Vegetable Proteins |
46.4 |
43.5 |
|
Animal Proteins |
43 |
56.9 |
|
Vegetable Fats |
30.8 |
60 |
|
Animal Fats |
57.3 |
62.7 |
|
Developing
Countries: |
|
|
|
Vegetable Proteins |
41 |
47.4 |
|
Animal Proteins |
8.6 |
21 |
|
Vegetable Fats |
19 |
38 |
|
Animal Fats |
9.6 |
27.2 |
|
|
Calories
Per Capita Supply Per Day |
| |
1961 |
2002 |
|
Developed
Countries: |
|
|
|
Vegetable Products |
2182 |
2441 |
|
Animal Products |
768 |
873 |
|
Developing
Countries: |
|
|
|
Vegetable Products |
1791 |
2308 |
|
Animal Products |
136 |
358 |
|
SOURCE:
Food and Agriculture Organization of the United
Nations (FAO). 2004. FAOSTAT on-line statistical service.
Rome: FAO.
|
|
