|
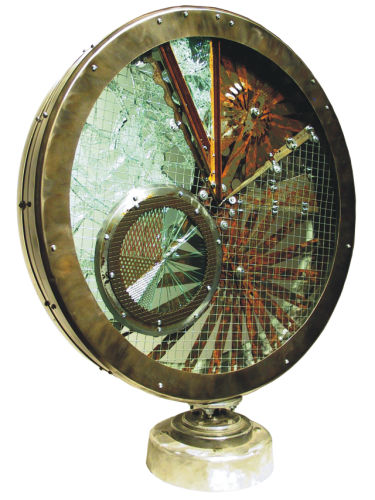
Carbon Emissions Study
1952-2002
22" diameter x 3" (freestanding)
found metal and glass
Brent Bukowski 2005
(Private Collection)
Wilhelm Nassau photo |
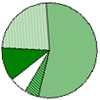
Carbon Emissions Study 1952
| |
1952 |
2002 |
|
Element |
tonnes
of carbon |
|
gas |
124 000 000 |
1 348 000 000 |
|
liquids |
504 000 000 |
2 883 000 000 |
|
solids |
1
119 000 000 |
2 472 000 000 |
|
cement production |
22 000 000 |
245 000 000 |
|
gas flaring |
26 000 000 |
27 000 000 |
|
Difference |
5
180 000 000 |
|
% change
from 1952 to 2002 |
+389% |
 |
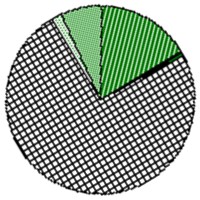
INSERT:
Carbon Emissions by Country 2000
| Country |
tonnes
of carbon |
| United
States |
1 528 796 000 |
| China |
761 586 000 |
| Russian
Fed. |
391 664 000 |
| Japan |
323 281 000 |
| All
other countries combined |
3 662 673 000 |
|
SOURCE:
Marland,
G., T.A. Boden, and R. J. Andres. 2005. Global, Regional, and
National CO2 Emissions. In Trends: A Compendium of
Data on Global Change. Carbon Dioxide Information Analysis
Center, Oak Ridge National Laboratory, U.S. Department of
Energy, Oak Ridge, Tenn., U.S.A. |
|
